A dedicated place per installation
Open an installation and choose Analyses. Everything you need to investigate its behaviour is in one place.
Data and control side by side
See not only what a battery or inverter did, but also which signal was behind it.
Ready-made or build your own
Start from a view, or add your own charts and compare periods.
Take the data into your own tools
Use the download button below each chart to get the data for your own analysis or reporting.
- Excel fileFor the interval you selected
- Quarter-hour data as CSVRaw quarter-hour values, up to a year back
Ask your question, see the answer straight away
Generation, battery, grid and consumption used to share one large chart, where you had to find the answer yourself. Now we've split that up: each chart answers one question.
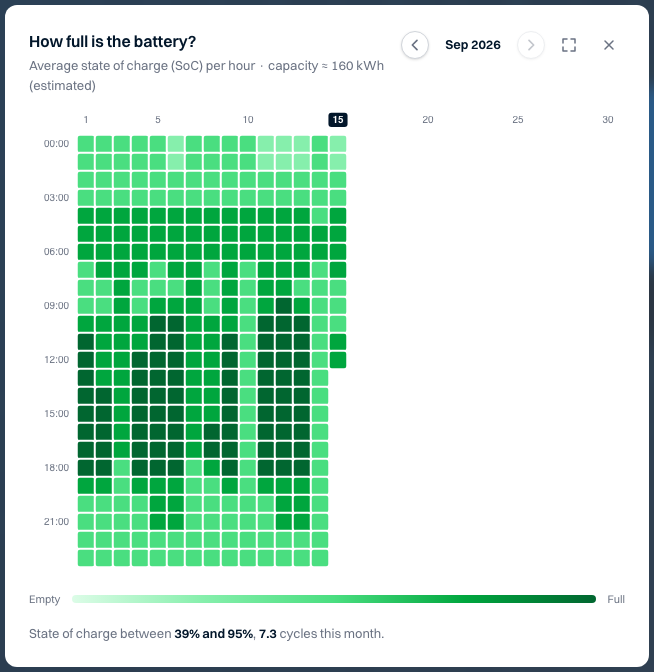
Why was the battery empty before the evening peak?
See how full the battery was for every hour, the whole month in one view.
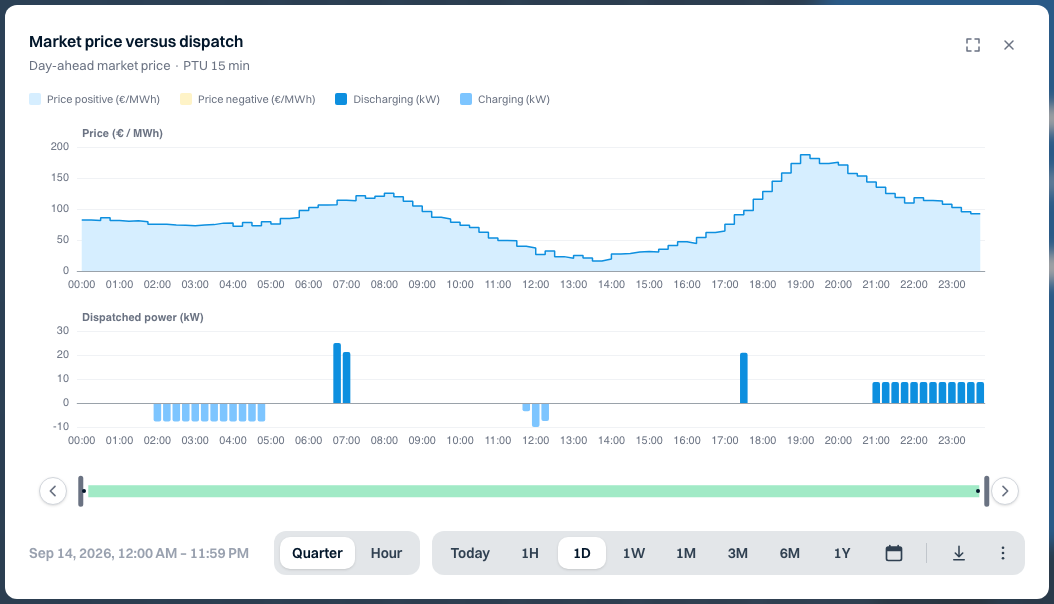
Does the battery charge when electricity is cheap?
See the market price next to the moments of charging and discharging.
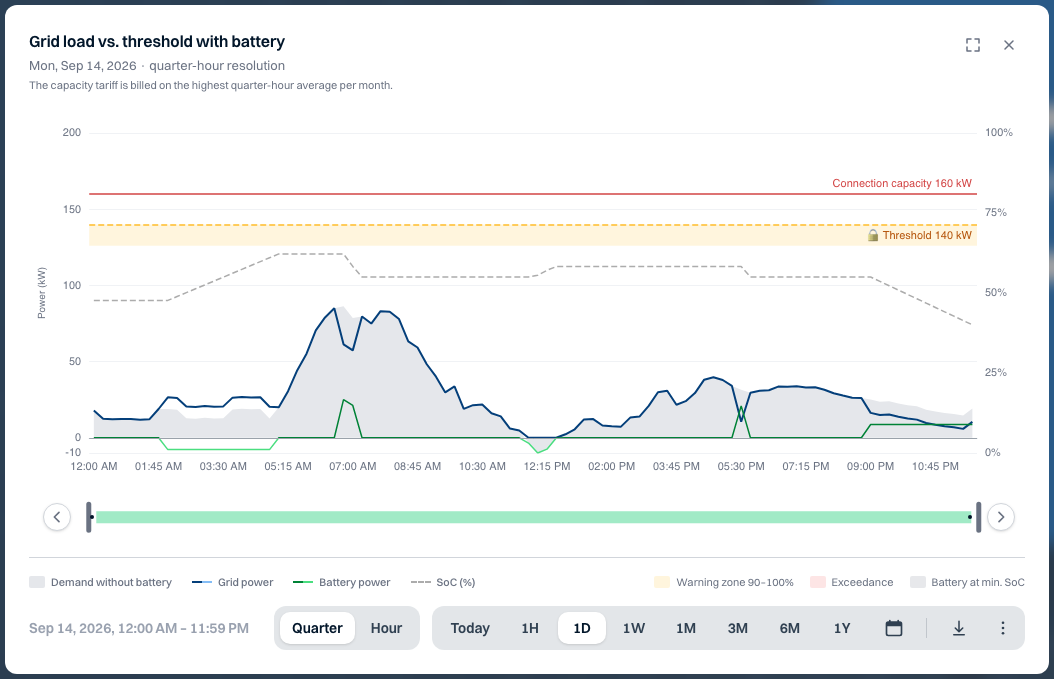
When do we get close to the threshold?
See the power on the connection next to your threshold, and what the battery did.
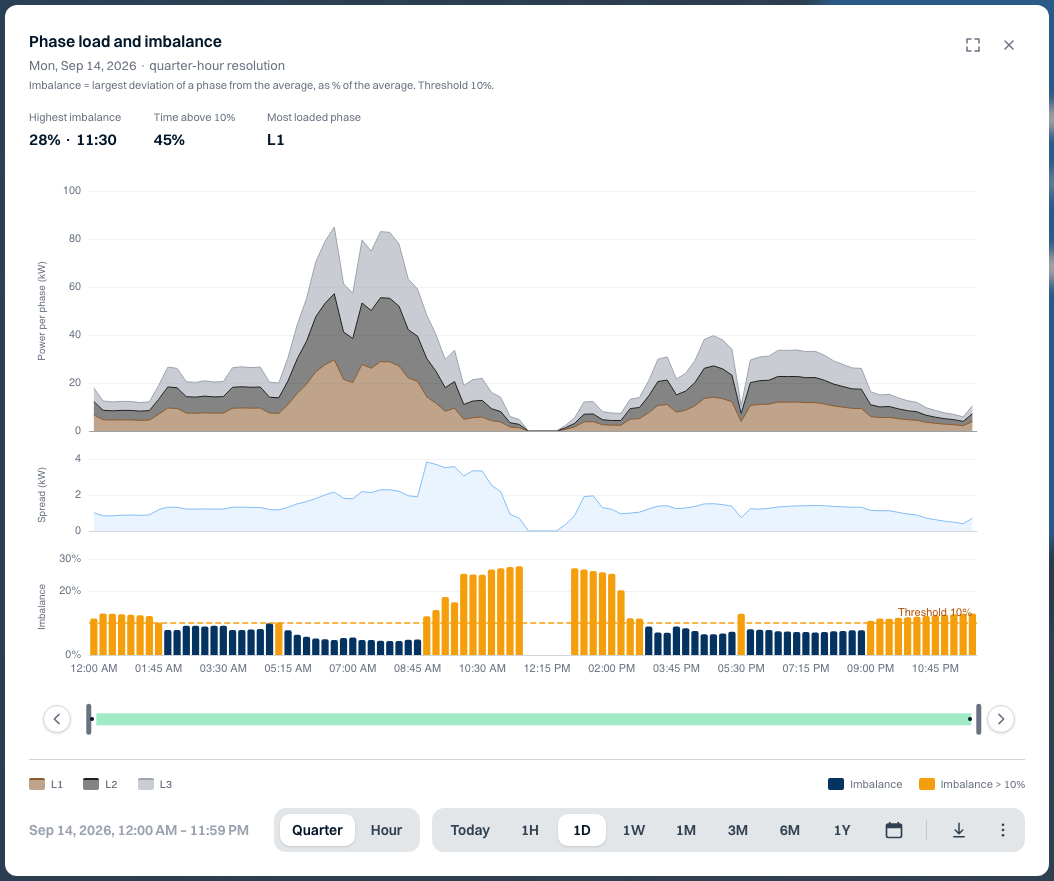
Is the load evenly spread across the phases?
See the power per phase and when the imbalance went above the threshold.
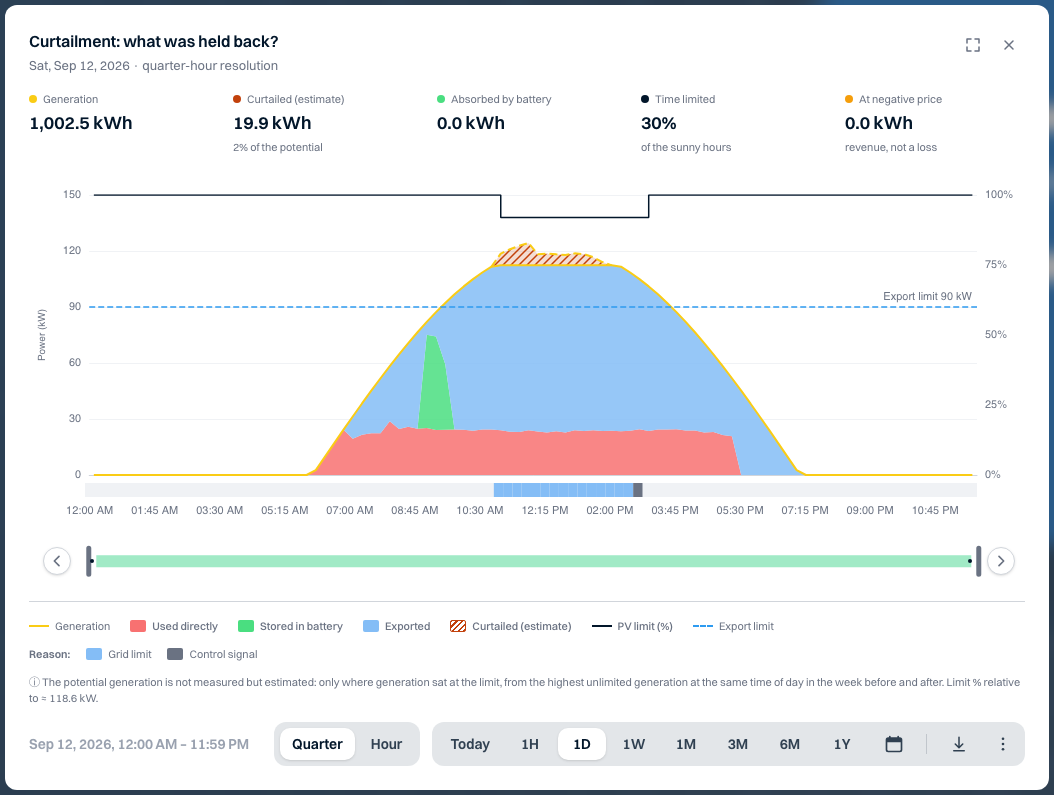
How much generation was held back, and why?
See when generation was limited and what caused it.
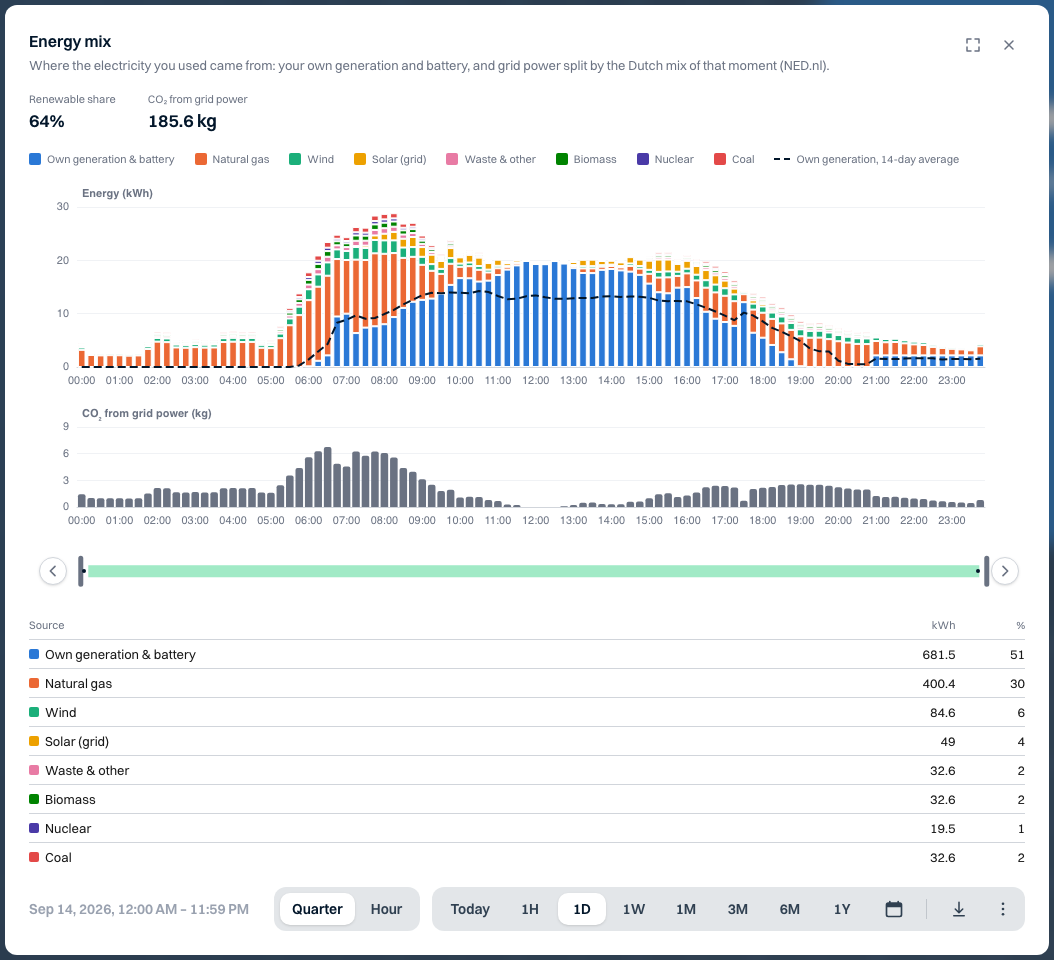
How green was the electricity we used?
See how much came from your own generation and what the grid share was made up of.
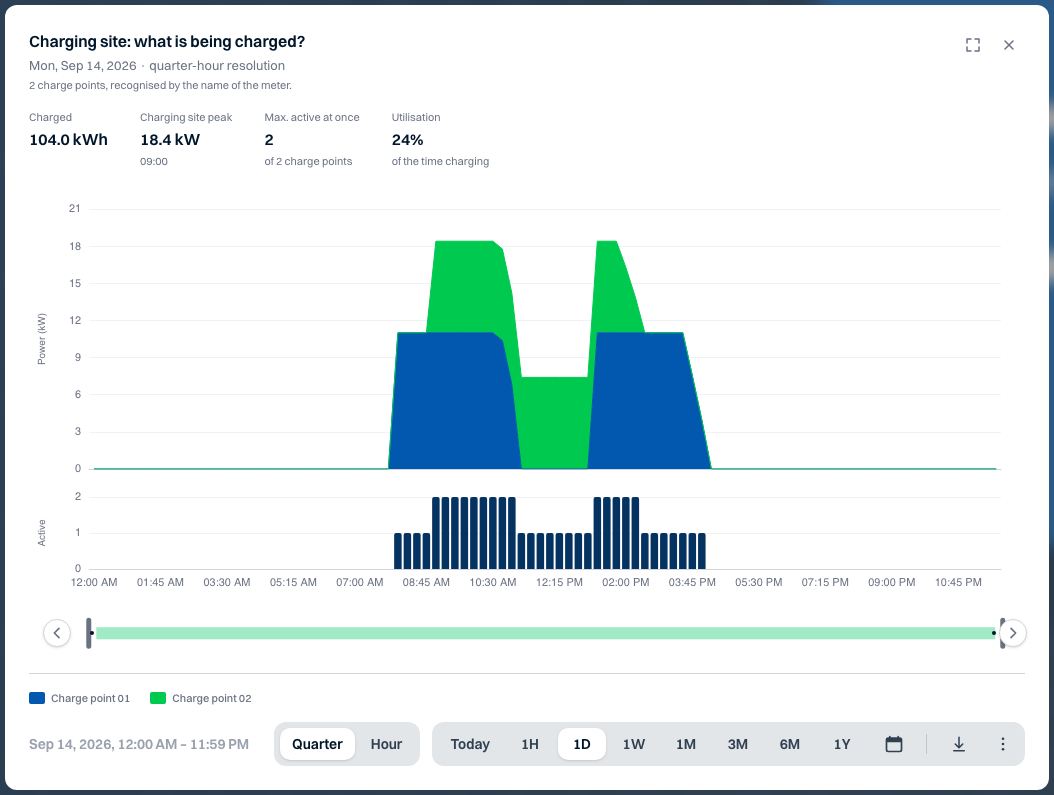
Are all charge points being used?
See the total charging power and how many charge points were active at the same time.
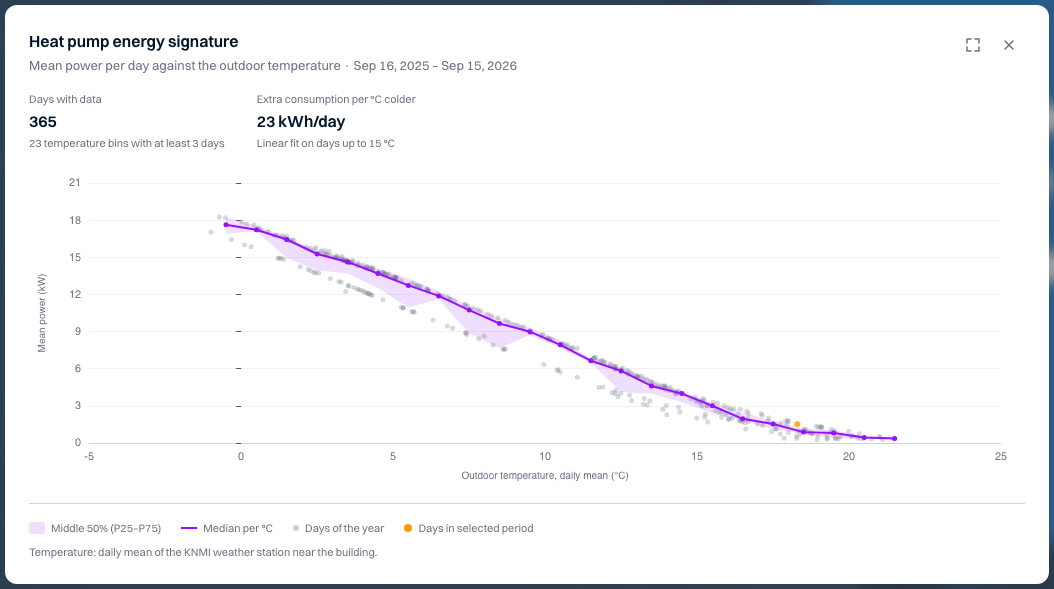
Does the heat pump use more than expected?
See consumption against the outdoor temperature, over a whole year.
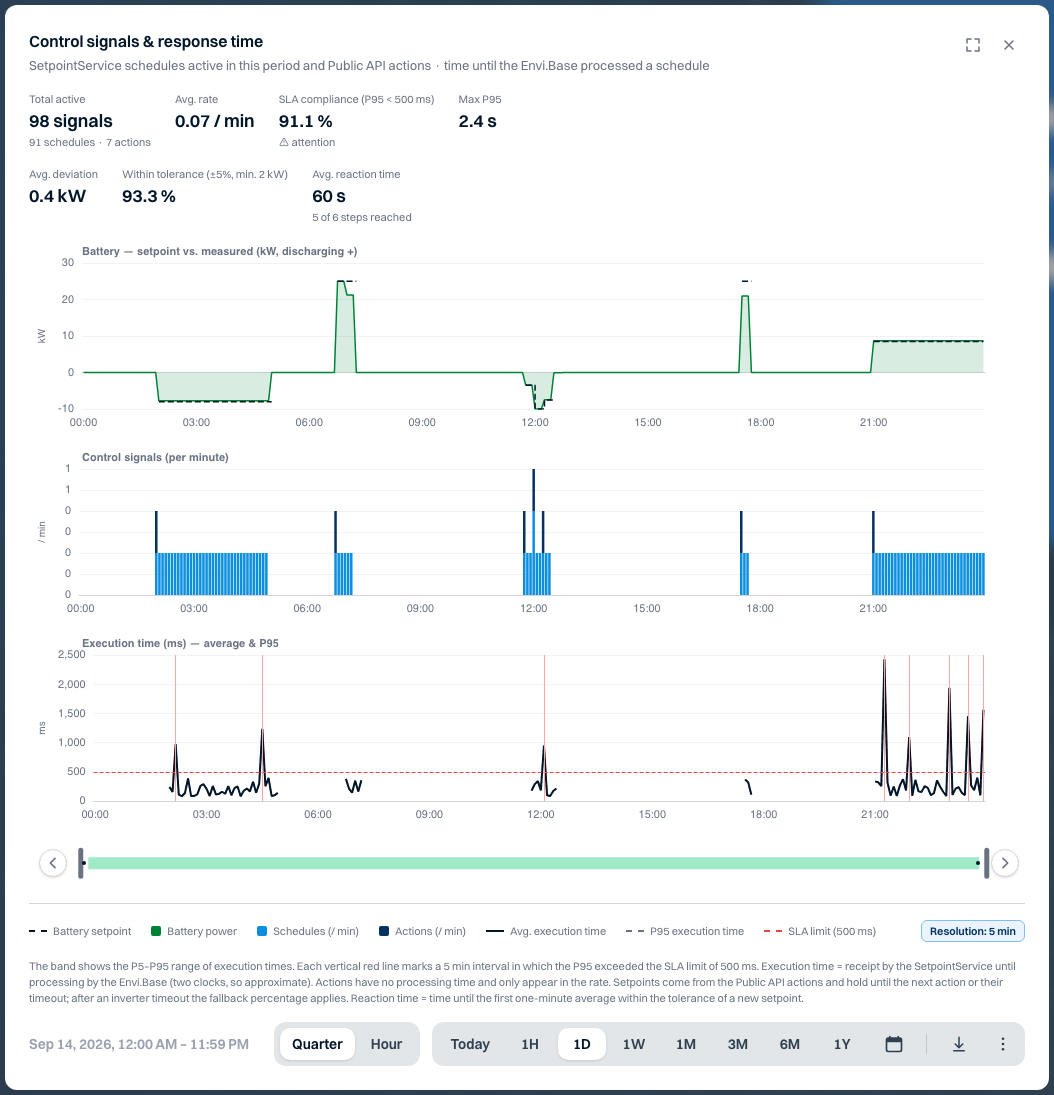
Does the battery follow the control signal?
See the setpoint next to the battery's measured power.
Ready to investigate for yourself?
- Open an installation in Watt
- Choose Analyses
- Start from a view, or build your own
You only see the views that fit what is connected to the installation.