Forecasts (Early Access)
On Forecasts you see, per installation, the expected generation and consumption, the battery plan the optimizer made, and why. This page is part of the Early Access Program: you only see the Forecasts menu item with the EAP label when your account takes part.
Forecasts is separate from Analyses. Analyses shows measured data over a period you choose, with views, saved chart sets and Export. Forecasts shows one day at a time, built around the forecast and the optimizer plan, and has no export. The Analyses tab inside Forecasts is also a view of its own and is not the same as the Analyses page.
The examples use Noorderlicht Distributiecentrum — Zwolle on 15 September 2026, with a 160 kWh battery and 120 kW of solar panels.
Choose a day
- Open Forecasts in the navigation for the selected installation.
- Choose a day: Yesterday, Today, Tomorrow or one of the following days. Other date or history opens a calendar; a dot means a forecast exists for that day.
- Choose a tab: Overview, Consumption, Generation, Planning, Prices or Analyses.
Times are shown in Dutch local time. On Today, a vertical line marks the current moment; measured values are to its left and the forecast to its right.
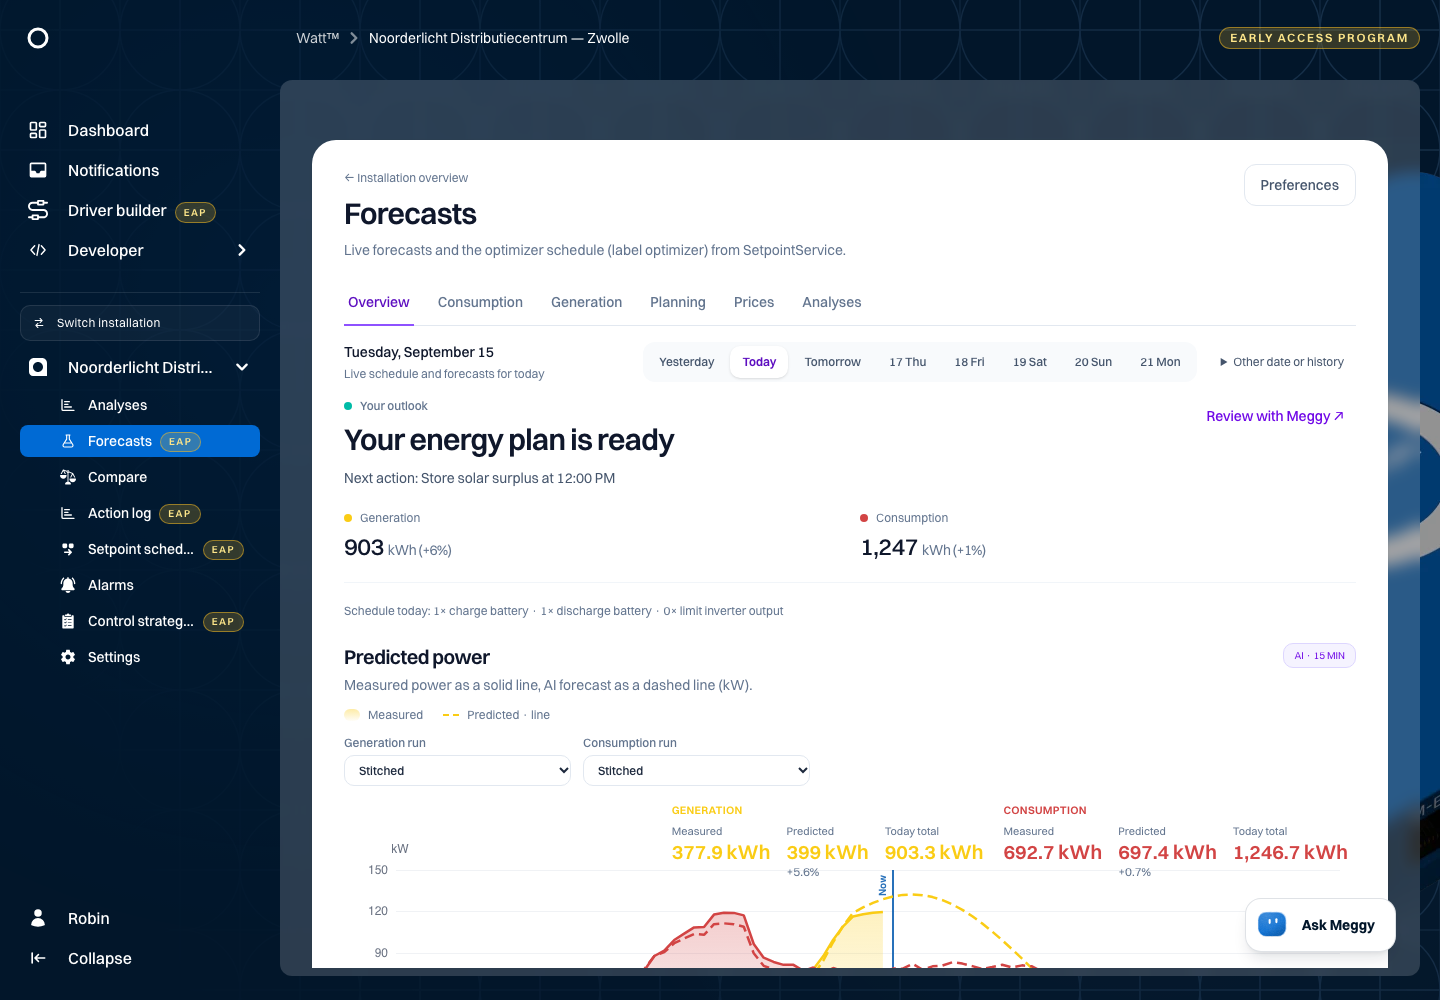
Overview
At the top is the outlook for the day: the next planned battery action and how many times the battery charges, discharges or limits inverter output that day. Below it you see generation and consumption in kW. The forecast is a dashed line; measured power is a solid line in the same colour.
The running totals at the top right of the chart show measured and forecast energy in kWh and the deviation in percent. On today, the comparison stops at the current moment and you also see the forecast day total. Hover over the chart to see the values and totals up to that point.
For today and earlier days, How good was the forecast? shows how far measured and forecast energy differ over the same elapsed quarter hours.
Consumption and Generation
These tabs show one stream at a time, with the same dashed forecast line and solid measured line. A new forecast (run) is made regularly. Use Generation run or Consumption run, here and in the Overview, to choose which forecast you see; the list only shows runs with values for the selected day. By default, Stitched shows the latest available forecast for each quarter hour. Select an individual run to see what was expected for that day when the run was made. If the stitched series is empty, Watt opens an available run.
Planning
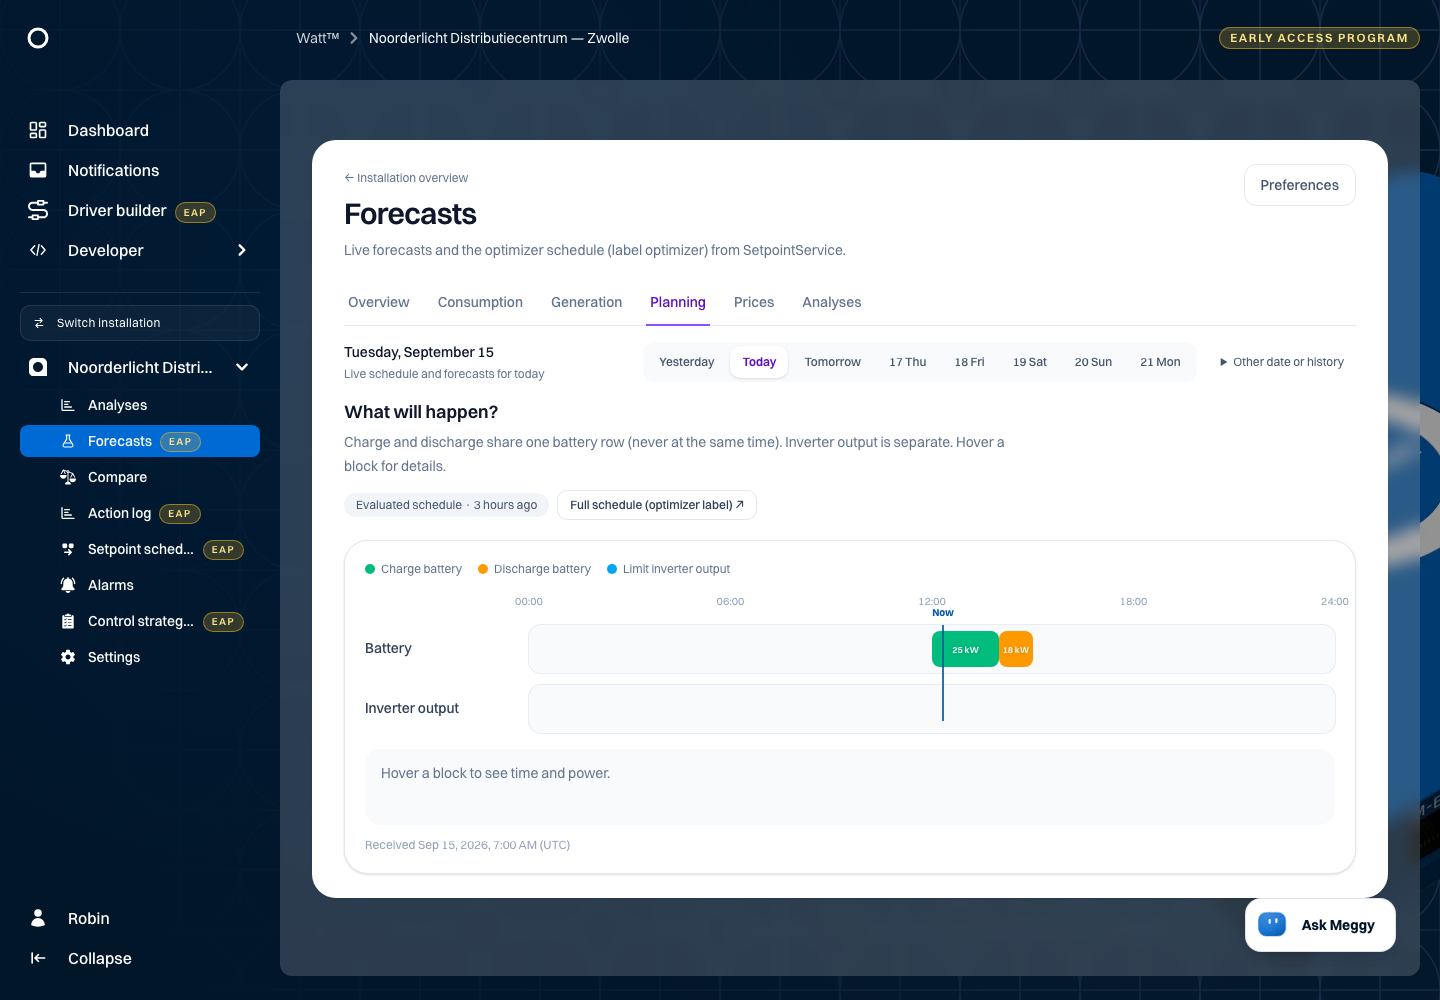
Planning shows the optimizer's battery plan as blocks on a timeline. Charging and discharging share one lane, because the battery never charges and discharges at the same time. Limiting inverter output has a lane of its own. Hover over a block to see its time and power.
In the example, the Zwolle battery charges at 25 kW from 12:00 to 14:00 and then discharges at 18 kW until 15:00.
Full schedule (optimizer label) opens the same schedule on Setpoint schedules, where you see when it was received and evaluated. The plan describes commands, not what the battery actually did; check that against the measurement in the Overview or on Analyses.
Explanations from Meggy
Choose Review with Meggy in the Overview, or click a block in Planning, to ask for an explanation. Meggy explains the trade-off behind the plan or that action, such as a low or high price, room in the battery or a grid limit. Meggy bases this on the published schedule and the configured constraints. The explanation does not change the plan. If no explanation is available for a schedule yet, Meggy says so.
Prices
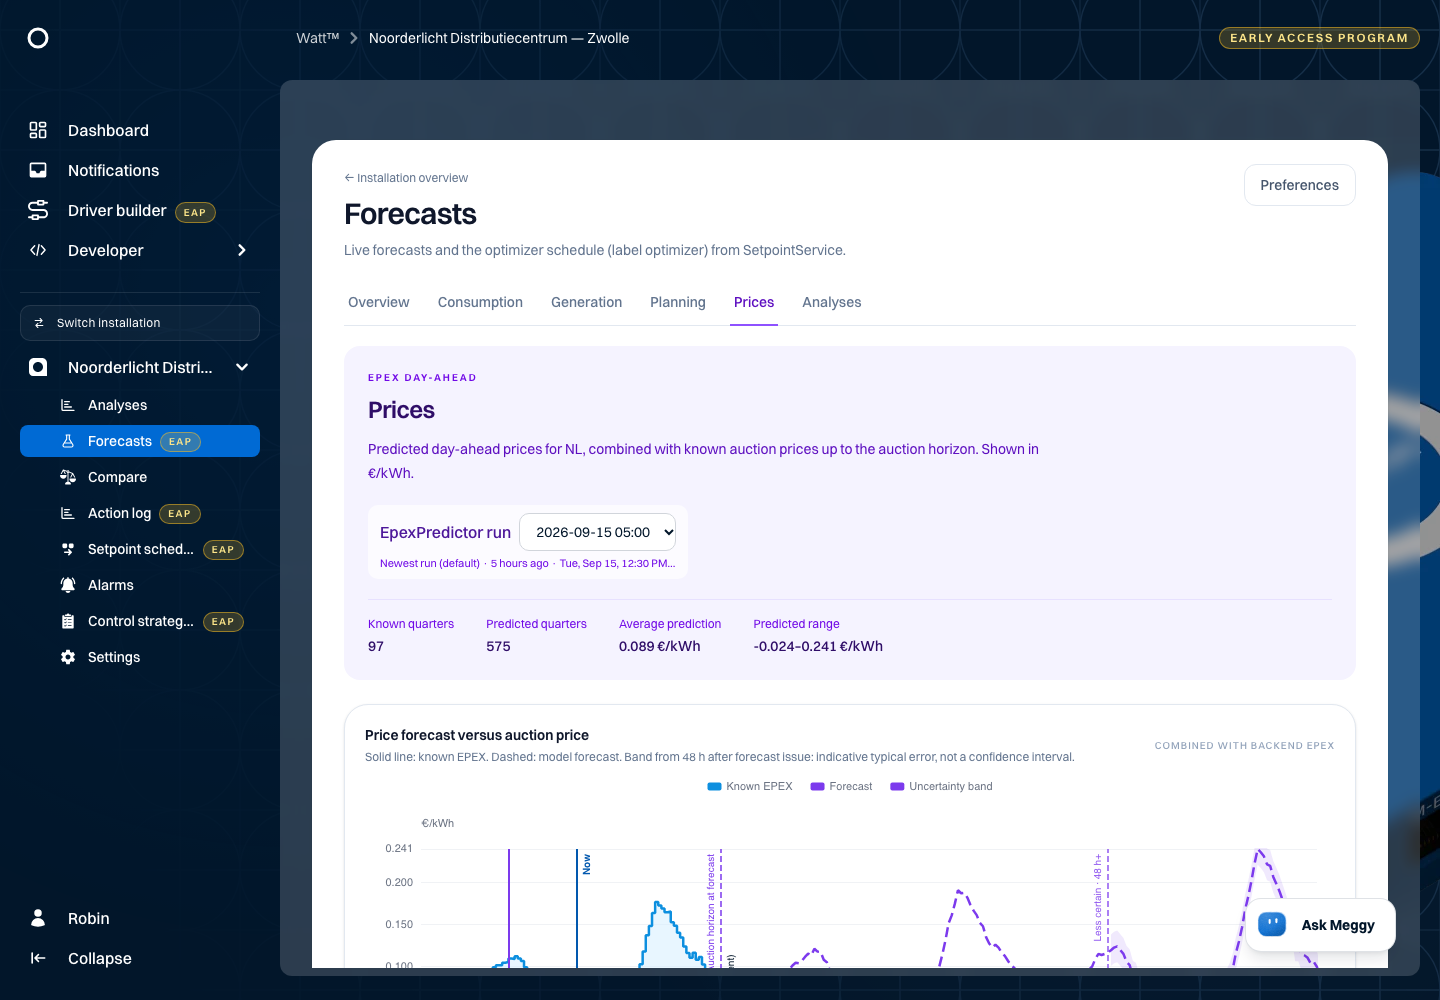
Prices shows forecast day-ahead prices in €/kWh, completed with the known auction prices while those are available. Use the list at the top to choose another price forecast; the newest is shown by default. Use this to see which prices the optimizer expected when the plan was made.
Analyses inside Forecasts
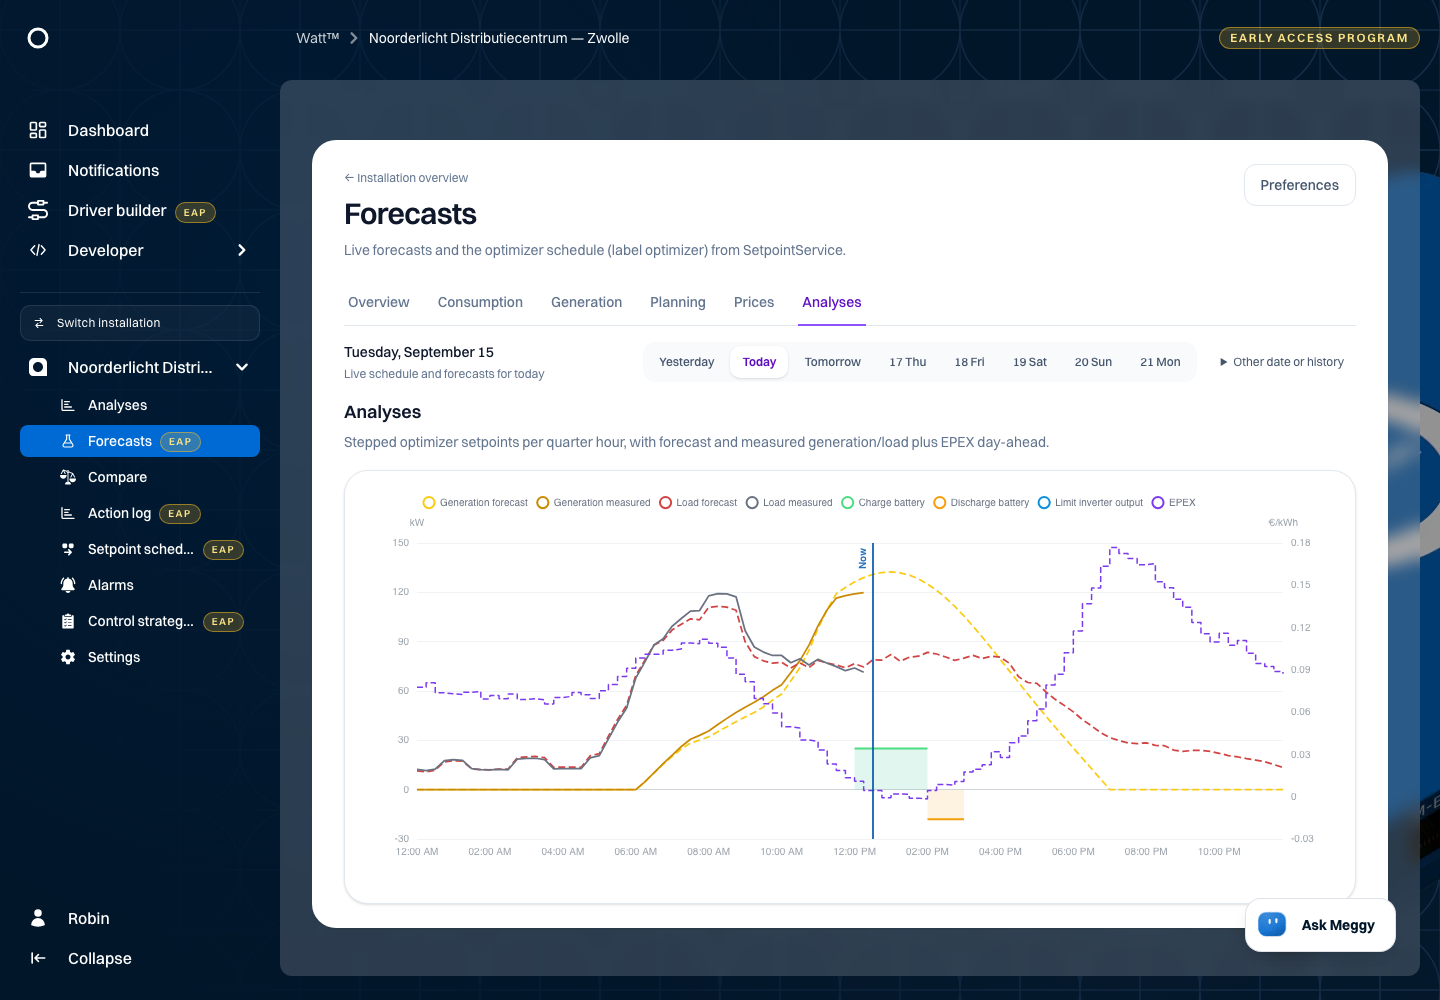
The Analyses tab places the battery plan for each quarter hour of the selected day next to forecast and measured generation and consumption. The day-ahead price (EPEX) is on the right axis in €/kWh. Click a series in the legend to hide or show it. This shows, for example, whether the battery charges in quarter hours with plenty of sun or a low price.
This tab has no views, no Add chart and no Export. For measured data over longer periods and for exports, use the Analyses page.
Preferences: constraints for the optimizer
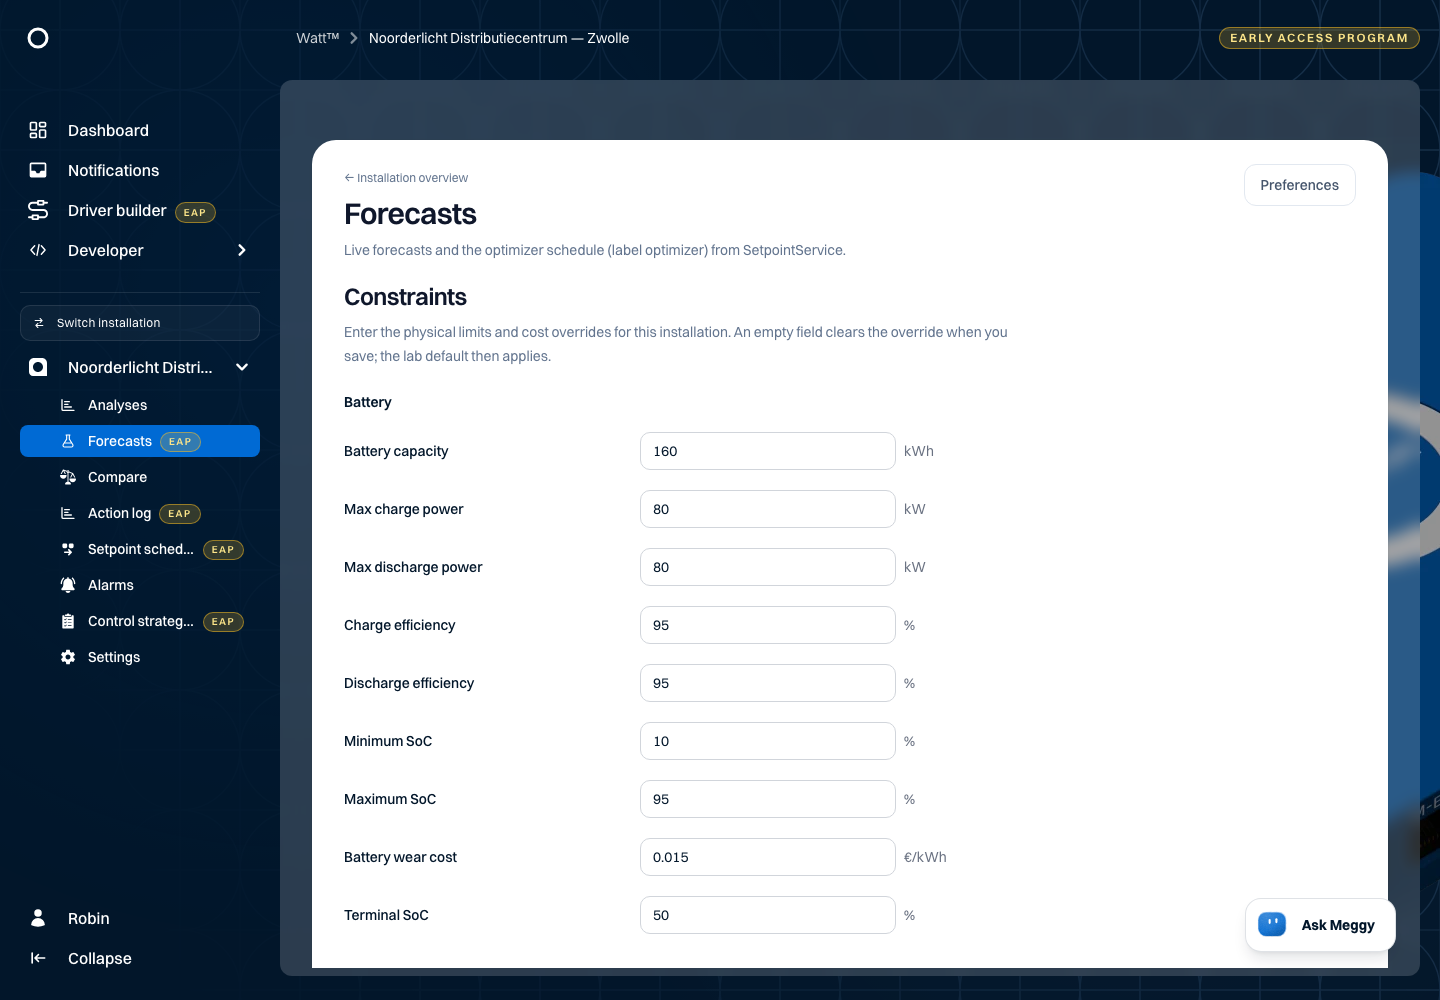
Use Preferences at the top right to set the limits and costs the optimizer works with. The form has the sections Battery, Grid, PV and Costs, covering for example capacity, charge and discharge power, minimum and maximum SoC, maximum grid import and export, and maximum PV power. Enter efficiencies and SoC as percentages.
An empty field means the optimizer uses its default value. If nothing has been set for an installation yet, the form starts empty and the first Save creates the constraints. Cancel closes the form without saving.
In the example, Zwolle has a battery capacity of 160 kWh, 80 kW charge and discharge power, an SoC between 10% and 95%, 160 kW maximum grid import, 100 kW maximum grid export and 120 kW PV.
After Save, check the message Constraints saved. Reopen Preferences and check the saved values.
Troubleshooting
| What you see | What to check |
|---|---|
| No Forecasts menu item | Your account does not take part in the Early Access Program, or you have not selected an installation yet. |
| No forecast for a day | Choose a day with a dot in the calendar. Days further ahead do not have a run yet. |
| Planning is empty | There is no optimizer schedule for that day. Check on Setpoint schedules whether the optimizer label has one for that day. |
| Forecast and measurement differ widely | Choose a more recent run under Generation run or Consumption run and check the measurement on Analyses. |
| Constraints could not be saved. | Check the values: no negative numbers, percentages between 0 and 100, and the minimum SoC not above the maximum SoC. Then save again. |