Colours in Watt
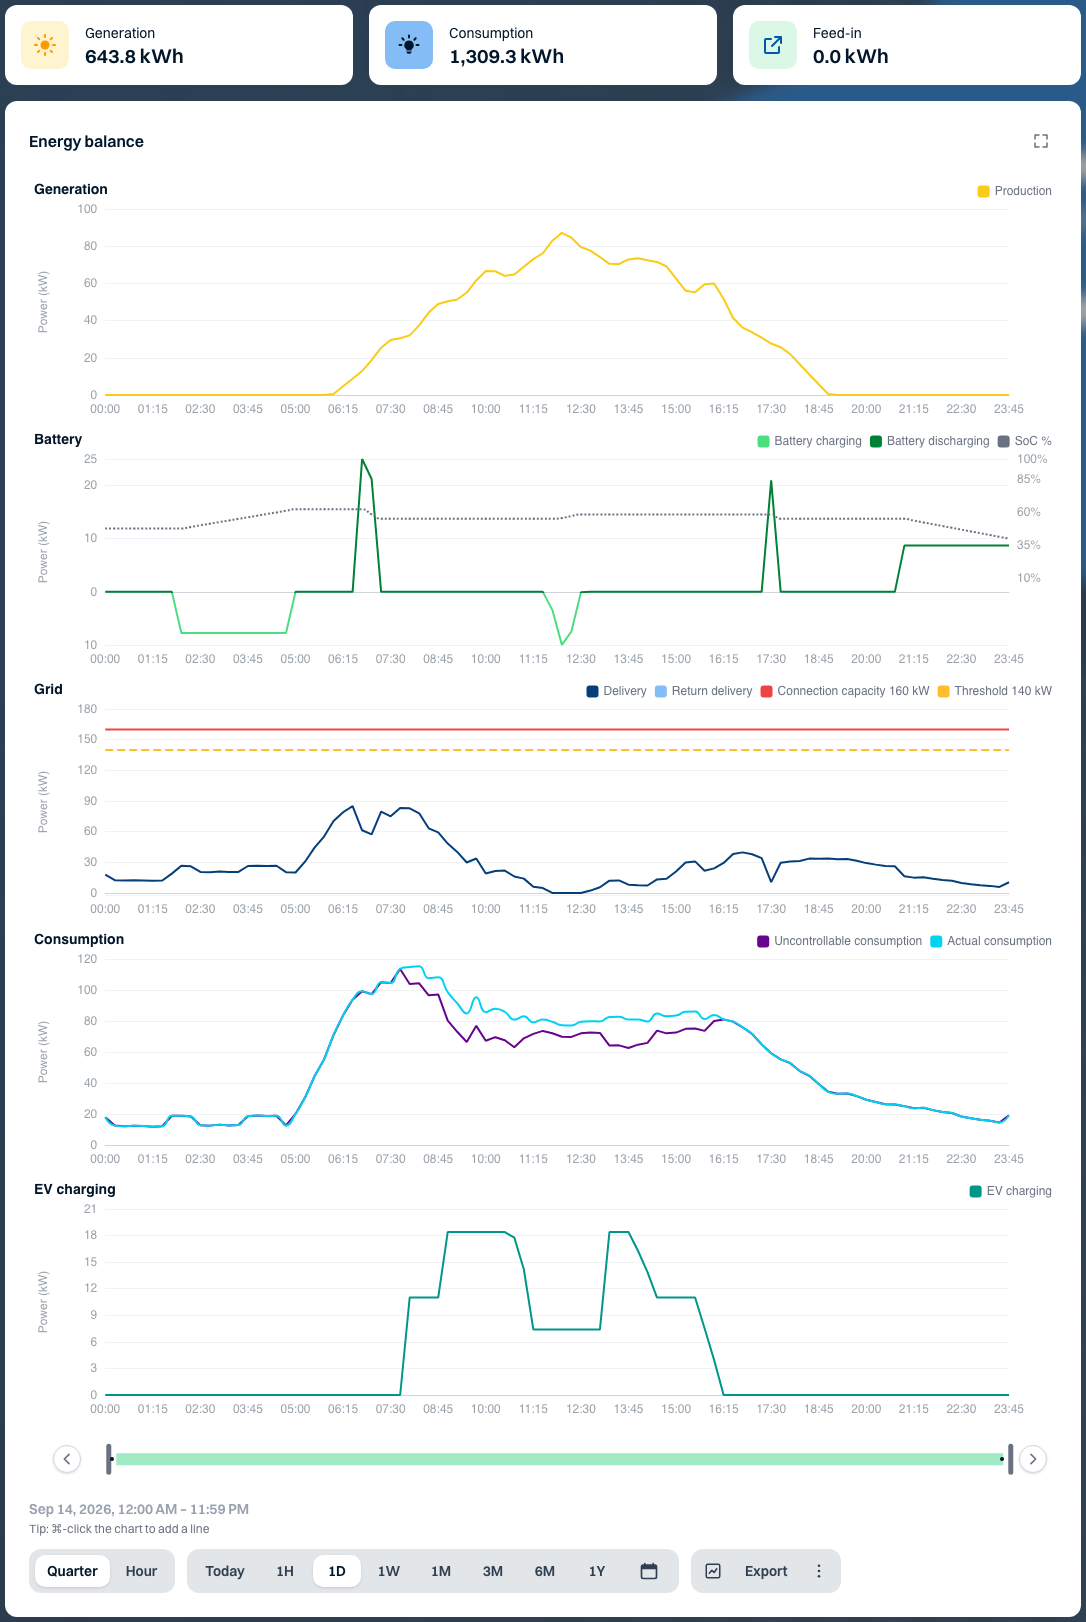
Open the energy balance for Noorderlicht Distributiecentrum — Zwolle. To check whether the solar panels are charging the battery or the site is exporting electricity, find the yellow generation series. At the same time on the chart, look for light green for battery charging and light blue for grid export. Hover over the chart to read the power in kW.
Energy flows and measurements
The table shows the standard colours. The legend beside each chart shows which series are available for your installation.
| Colour | Series | What it shows |
|---|---|---|
| Yellow | Solar generation | Power generated by the solar panels. |
| Slate grey | Generator | Generator output in Solar and generator production. |
| Dark blue | Grid import | Electricity drawn from the grid. |
| Light blue | Grid export | Electricity fed back into the grid. |
| Light green | Battery charging | Power flowing into the battery. |
| Dark green | Battery discharging | Power supplied by the battery. |
| Cyan | Actual consumption | Total consumption, including charge points. |
| Deep purple | Uncontrollable consumption | Consumption after subtracting the power drawn by charge points. |
| Teal | EV charging | Total power drawn by vehicles while charging. |
| Violet | Heat pump | Electrical power drawn in the heat pump chart. |
| Sea green | Wind | Wind’s share in Energy mix. |
| Orange | Natural gas | Natural gas’s share in Energy mix. |
| Sky blue | Water | Water consumption on the Water tab. |
Limits, prices and status
- Grid load shows connection capacity as a red line. The configured threshold is a dashed amber line. The pale amber band covers 90–100% of that threshold. Read the label beside the line for the type of limit and its value in kW.
- In Trading, the bright blue line shows the market price. The area is pale blue for a positive price and pale yellow for a negative price. Read the value on the price axis.
- The grey SoC line shows how full the battery is, as a percentage. In the monthly State of charge chart, darker green cells indicate a higher average state of charge. Hover over a cell to see the value for that hour.
- In a notification, green confirms a successful action, amber calls for attention, red indicates an error and blue provides information. Read the message for the next step.
Recognise lines without colour
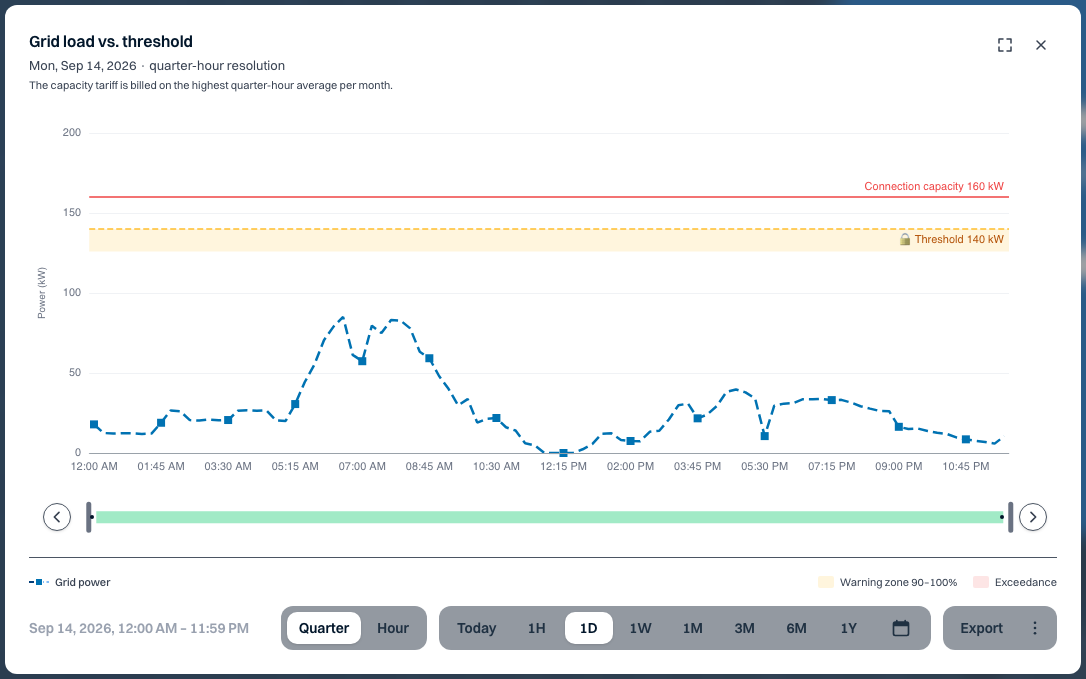
In Analyses, open the Period bar menu. Turn on Line patterns or Markers and match the line to the sample beside its name in the legend. You can also turn on High contrast in the account menu. This enables both options and adjusts chart colours. In the example below, the dashes and square markers identify Grid power.
The Old details screen uses its own colours for electricity. For example, generation is green and actual consumption is red. When comparing screens, use the series name and unit in the legend.