Submeters
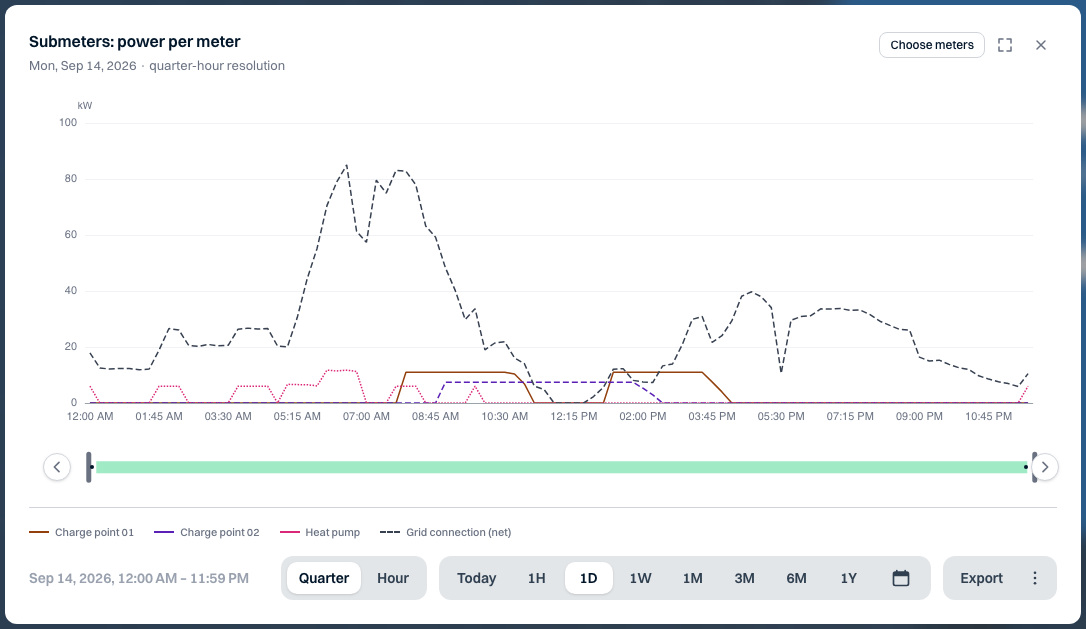
The power of the meters under the main meter as lines, with the net power of the grid connection as a dashed line.
What you see
See which meter drives the load and when. The 8 meters with the highest average power are shown apart; the rest are added up as one line. With Choose meters you tick which meters you see; only those meters contribute. The choice is saved for everyone with access to this installation. With a one-month interval the chart shows energy (kWh) instead of power.
When it is useful
Use this to find where a grid peak comes from. In Zwolle these are Charge point 01, Charge point 02 and Heat pump. Solar and battery meters have their own charts.
Choose Add chart and then Submeters. The chart is greyed out with No submeters.
Back to Analyses.