Curtailment duration curve
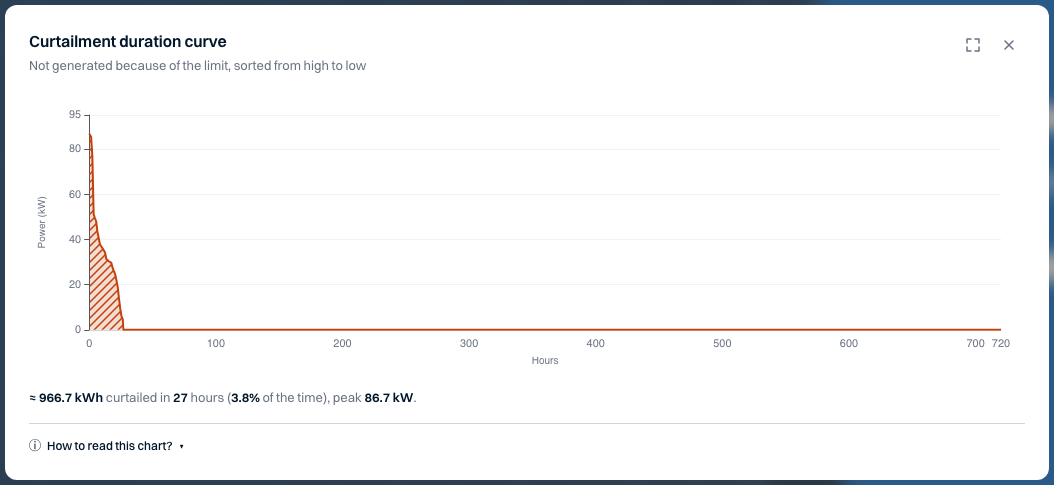
Held-back power sorted from high to low over the period.
What you see
Steep curve = short peaks (a small battery helps); flat curve = long limiting (more export or kWh).
When it is useful
Use a month or longer for investment questions; a single day is a snapshot.
Add via Add chart → Curtailment duration curve.
Back to Analyses.